
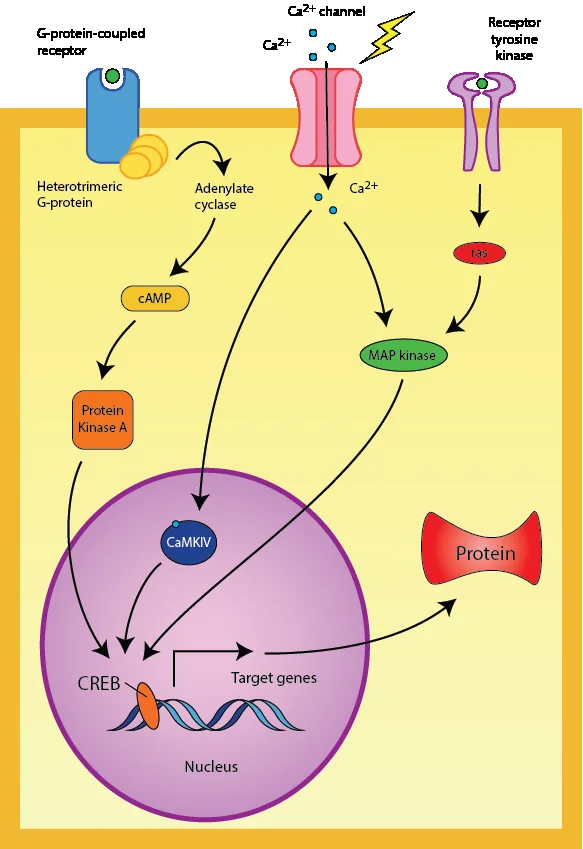
Open any paper on a signaling peptide and you will find one: a dense diagram of boxes, circles, and arrows tracing how a molecule outside the cell changes what happens inside it. Signaling pathway maps for peptides are the shared visual language of receptor pharmacology — and like any language, they are easy to misread until you learn the grammar. This guide teaches researchers how to read signaling pathway maps for peptides with confidence: what the shapes and arrows mean, how to trace a signal from ligand to cellular output, and how to avoid the classic misreadings. As a running example we will use the growth hormone-releasing hormone (GHRH) pathway — the signaling context behind GHRH analogues such as CJC-1295 that appear in the published literature. Educational and research-framed throughout; nothing here is medical advice or a use recommendation.
Research-use-only disclaimer: All products on this site are sold strictly for laboratory research use. This article explains how to read signaling pathway maps for peptides as published scientific diagrams. It contains no dosage information, no administration instructions, and no medical advice.
What Signaling Pathway Maps for Peptides Actually Show
At their simplest, signaling pathway maps for peptides answer one question: after the peptide binds its receptor, what happens next? The map compresses a chain of molecular events into a single picture. The recurring cast of characters is small, and once you recognize it, every map starts to look familiar:
- The ligand — the peptide itself (e.g., GHRH), shown at the top or outside the cell.
- The receptor — usually a G protein-coupled receptor (GPCR) spanning the cell membrane, the peptide’s molecular lock.
- Transducers — G proteins and enzymes such as adenylate cyclase that convert the binding event into an intracellular signal.
- Second messengers — small diffusible molecules like cAMP or calcium ions that spread the signal inside the cell.
- Effectors — kinases such as protein kinase A (PKA) that phosphorylate target proteins.
- The output — the cellular response: hormone release, gene transcription, metabolic change.
Every one of the signaling pathway maps for peptides you will encounter is built from these parts in some arrangement. The skill is not memorizing each map — it is recognizing the pattern and knowing which questions to ask of it. Background on the receptor family that dominates peptide signaling is available via the G protein-coupled receptor article on Wikipedia.
The Visual Vocabulary of Pathway Maps
Before tracing any signal, learn the legend. Signaling pathway maps for peptides use a consistent set of graphical conventions, and misreading an arrow is the single most common error beginners make:
Pathway map legend — the five symbols that matter most. → A pointed arrow means activation or stimulation: the upstream molecule turns the downstream one on. ⊣ A blunt or T-bar arrow means inhibition: the upstream molecule suppresses the downstream one. Dashed arrows usually indicate an indirect effect, translocation, or a multi-step process collapsed for simplicity. Double-headed or circular arrows suggest feedback — the output looping back to regulate the input. Membrane lines (double bars) mark the cell boundary: everything above is extracellular, everything below is intracellular. Read every map against this legend before trusting your eyes.
Two more conventions complete the vocabulary. Node shape often encodes molecule type — ovals for proteins, small circles for second messengers, rectangles for genes — though conventions vary between databases, so check each map’s own key. And color typically highlights the pathway of interest or flags molecules with available drugs or tool compounds; it rarely carries mechanistic meaning. With the legend in hand, you are ready to read signaling pathway maps for peptides the way their authors intended: as an argument about mechanism, not as decoration.
How to Read a Pathway Map: The Five-Step Trace
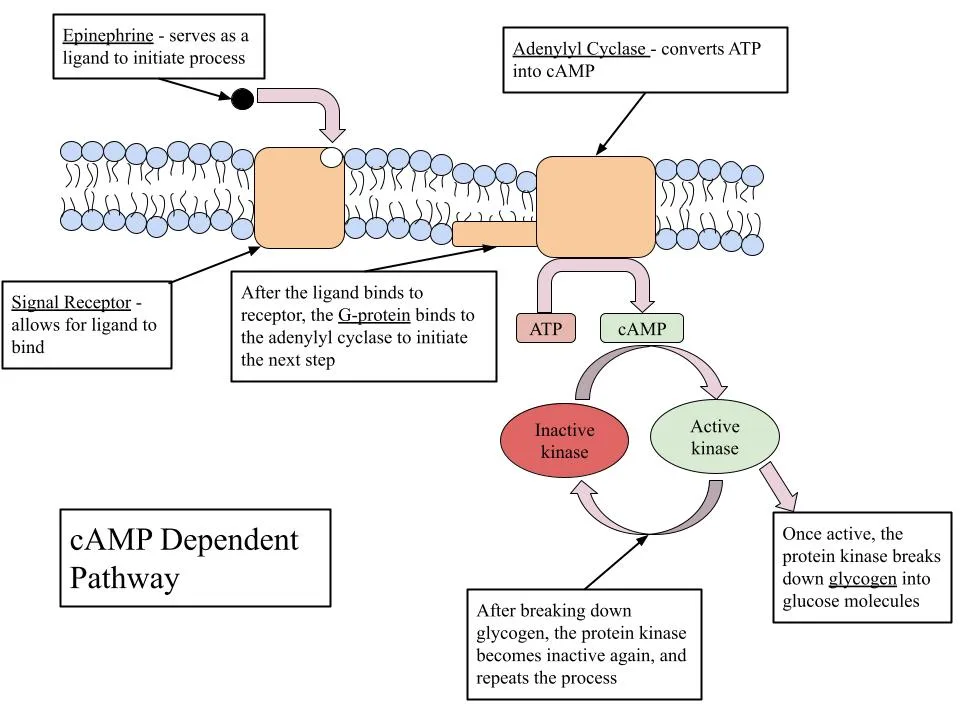
Here is the practical method. Apply it to any of the signaling pathway maps for peptides you meet in the literature, in this order:
- Find the ligand and its entry point. Locate the peptide at the map’s edge — usually top-left or extracellular — and identify which receptor it binds. If the map shows several ligands, note which one is the focus; the others are context.
- Identify the receptor class and its G protein. For peptide GPCRs, the coupled G protein (Gs, Gi, or Gq) predicts the entire downstream cascade. Gs stimulates adenylate cyclase; Gi inhibits it; Gq activates phospholipase C. This one detail tells you which second messenger to expect.
- Follow the second messenger. Trace cAMP, calcium, IP3, or DAG from its production to its targets. Second messengers amplify the signal — one receptor activation can generate many messenger molecules — which is why a faint extracellular signal produces a strong intracellular response.
- Find the effectors and the cellular output. Kinases like PKA phosphorylate specific target proteins; transcription factors like CREB switch genes on or off. The map’s bottom edge usually names the physiological output — secretion, growth, metabolic shift.
- Check for feedback and inhibition. Look for blunt arrows and loops: inhibitory inputs (like somatostatin in GH regulation) and feedback from the output back to earlier steps. A map read without its inhibitory arms is a map half-read.
Ask “in which cell?” Signaling pathway maps for peptides are composites — they assemble findings from many studies, often in different cell types, into one clean diagram. A pathway drawn from pituitary cells may not operate identically in neurons or liver cells. Before applying a map to your research question, check which cell system the underlying evidence comes from.
Worked Example: The GHRH → cAMP Pathway
Now let’s apply the method to a concrete case from the peptide literature. Growth hormone-releasing hormone (GHRH) is the hypothalamic peptide that tells the pituitary to release growth hormone, and synthetic GHRH analogues — including CJC-1295, studied in published human research — act through this same receptor system. Tracing signaling pathway maps for peptides in this family looks like this:
Card 1 — GHRH → GHRHR → Gs → cAMP → PKA → GH release
GHRH binds the GHRH receptor (GHRHR), a Gs-coupled GPCR on pituitary somatotroph cells. The activated Gs protein stimulates adenylate cyclase, which converts ATP to the second messenger cAMP. Rising cAMP activates protein kinase A (PKA), which phosphorylates targets that drive both the release of stored growth hormone and, via the transcription factor CREB, longer-term gene expression changes. This Gs → adenylate cyclase → cAMP → PKA chain is the canonical stimulatory cassette, and it appears — with different ligands and outputs — across dozens of signaling pathway maps for peptides. (See the cAMP-dependent pathway overview for the general mechanism.)
Card 2 — Somatostatin → SSTR → Gi → inhibition
The same pituitary cells also carry somatostatin receptors (SSTRs), which couple to Gi — the inhibitory G protein. When somatostatin binds, Gi suppresses adenylate cyclase, cAMP falls, and growth hormone release is restrained. On a pathway map this appears as the blunt inhibitory arrow opposing Card 1. The GH axis is therefore a push-pull system, and any honest reading of signaling pathway maps for peptides in this family must include both arms: stimulation through Gs and restraint through Gi.
Card 3 — Ghrelin → GHS-R → Gq → PLC → calcium
A third input, ghrelin, acts through the growth hormone secretagogue receptor (GHS-R), a Gq-coupled GPCR. Gq activates phospholipase C, generating IP3 and DAG and releasing calcium from intracellular stores — a different second-messenger language producing a convergent output: more growth hormone release. Comparing Cards 1 and 3 shows why learning the G-protein code matters: same physiological neighborhood, different molecular route, and the pathway map makes the difference visible at a glance.
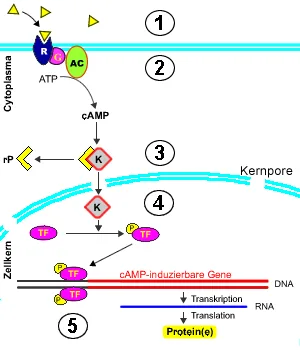
Notice what the three cards together demonstrate about signaling pathway maps for peptides as a genre: they let you compare mechanisms side by side, spot where two ligands converge or oppose each other, and predict what a new compound acting at one of these receptors would be expected to do at the signaling level — always as a research hypothesis, never as a human claim.
Common Misreadings of Pathway Maps
Even experienced readers stumble. The most frequent errors in reading signaling pathway maps for peptides:
- Treating the map as a single experiment. It is a synthesis. Individual arrows may come from different papers, species, and decades.
- Ignoring what is missing. Maps omit kinetics (how fast), stoichiometry (how much), and desensitization (receptors turn off with prolonged stimulation) — all of which determine what actually happens in a living cell.
- Confusing “can signal” with “does signal.” A drawn connection means the mechanism has been reported, not that it dominates in every context. Cell type, receptor density, and ligand concentration decide.
- Missing the inhibitory half. Beginners trace the exciting activation arrows and skip the blunt inhibitory ones — yet inhibition often determines the net output.
Use maps to generate hypotheses, not conclusions. Signaling pathway maps for peptides are at their best when they suggest the next experiment: if the map says cAMP rises, measure cAMP; if it says PKA acts, test a PKA inhibitor. The map is the question, elegantly drawn — the experiment is the answer.

Researchers who want to see how this signaling literacy connects to actual research compounds can browse our research library — including the Semax 10mg and Selank 10mg research listings — and compare how different peptide families are framed in our Selank vs Semax research comparison and our research overviews on Semax nasal spray and Selank nasal spray formats. The published primary literature behind any pathway remains indexed on PubMed, which is where every arrow on every map should ultimately be traceable.
Key Takeaways: Signaling Pathway Maps for Peptides
Learn the legend first — activation arrows, inhibition bars, feedback loops, membrane boundaries — then trace every map in five steps: ligand, receptor and G protein, second messenger, effectors and output, feedback. Worked through the GHRH family, signaling pathway maps for peptides reveal a push-pull system of Gs stimulation, Gi restraint, and Gq convergence. Read maps as hypotheses to test, composites to unpack, and never as proof of human effects. (Research framing only — a diagram-reading skill, not a use recommendation.)
Signaling Pathway Maps for Peptides: Frequently Asked Questions
Quick answers on reading and using pathway diagrams in peptide research.
What do the arrows mean in signaling pathway maps for peptides?
A pointed arrow means activation or stimulation; a blunt T-bar arrow means inhibition. Dashed arrows usually indicate indirect effects or multi-step processes shown in simplified form, and circular arrows suggest feedback. Checking the map’s own legend is always the first step in reading signaling pathway maps for peptides correctly.
What is the GHRH signaling pathway?
GHRH binds the Gs-coupled GHRH receptor on pituitary cells, activating adenylate cyclase, raising cAMP, and activating protein kinase A (PKA) — driving growth hormone release and CREB-mediated gene expression. Somatostatin opposes it through Gi-coupled receptors, and ghrelin converges on the same output via a Gq–calcium route. This push-pull architecture is typical of the signaling pathway maps for peptides in endocrine families.
Why do most peptide receptors use G proteins?
The majority of peptide receptors are G protein-coupled receptors (GPCRs). The coupled G protein — Gs, Gi, or Gq — determines the downstream cascade: Gs stimulates cAMP production, Gi inhibits it, and Gq mobilizes calcium. Identifying the G protein is the fastest way to predict a receptor’s signaling logic from signaling pathway maps for peptides.
Are pathway maps based on single studies?
No. Signaling pathway maps for peptides are composites assembled from many studies, often across different cell types, species, and years. Individual arrows should be traceable to primary literature — PubMed is the place to verify them — and the map should be read as a synthesis, not a single experiment.
What do pathway maps leave out?
Kinetics, concentrations, receptor desensitization, and cell-type specificity are routinely absent. A map shows that a connection has been reported, not that it dominates in every context. These gaps are why signaling pathway maps for peptides generate hypotheses rather than conclusions.
Where can I find reliable pathway diagrams?
Peer-reviewed papers, curated databases, and educational resources such as the signal transduction overview on Wikipedia are good starting points. For any specific arrow, trace it back to the primary literature indexed on PubMed.
Final Notes on Signaling Pathway Maps for Peptides
Signaling pathway maps for peptides reward the reader who slows down. Learn the five symbols, run the five-step trace, ask which cell the evidence came from, and always read the inhibitory half of the picture. Done well, a pathway map stops being an intimidating tangle and becomes what it was meant to be: a compact, testable story about how a peptide moves a cell. Keep that discipline, and every map you meet — from GHRH to the newest orphan receptor — will open up on the first careful reading.